


Spurs look threatening. Shouldn't the xG be higher?
The difference between expected goals and expected threat.

This post is inspired by a discussion on The Extra Inch podcast (S9E8: Lily Livered), which I highly recommend you check out if you haven’t already. It’s one of my favorite Spurs podcasts, particularly for tactical discussions. In the episode, Nathan A. Clark responds to a listener’s question about why Spurs don’t register a higher expected goals (xG) when the eye test suggests we look very threatening and create tons of chances.
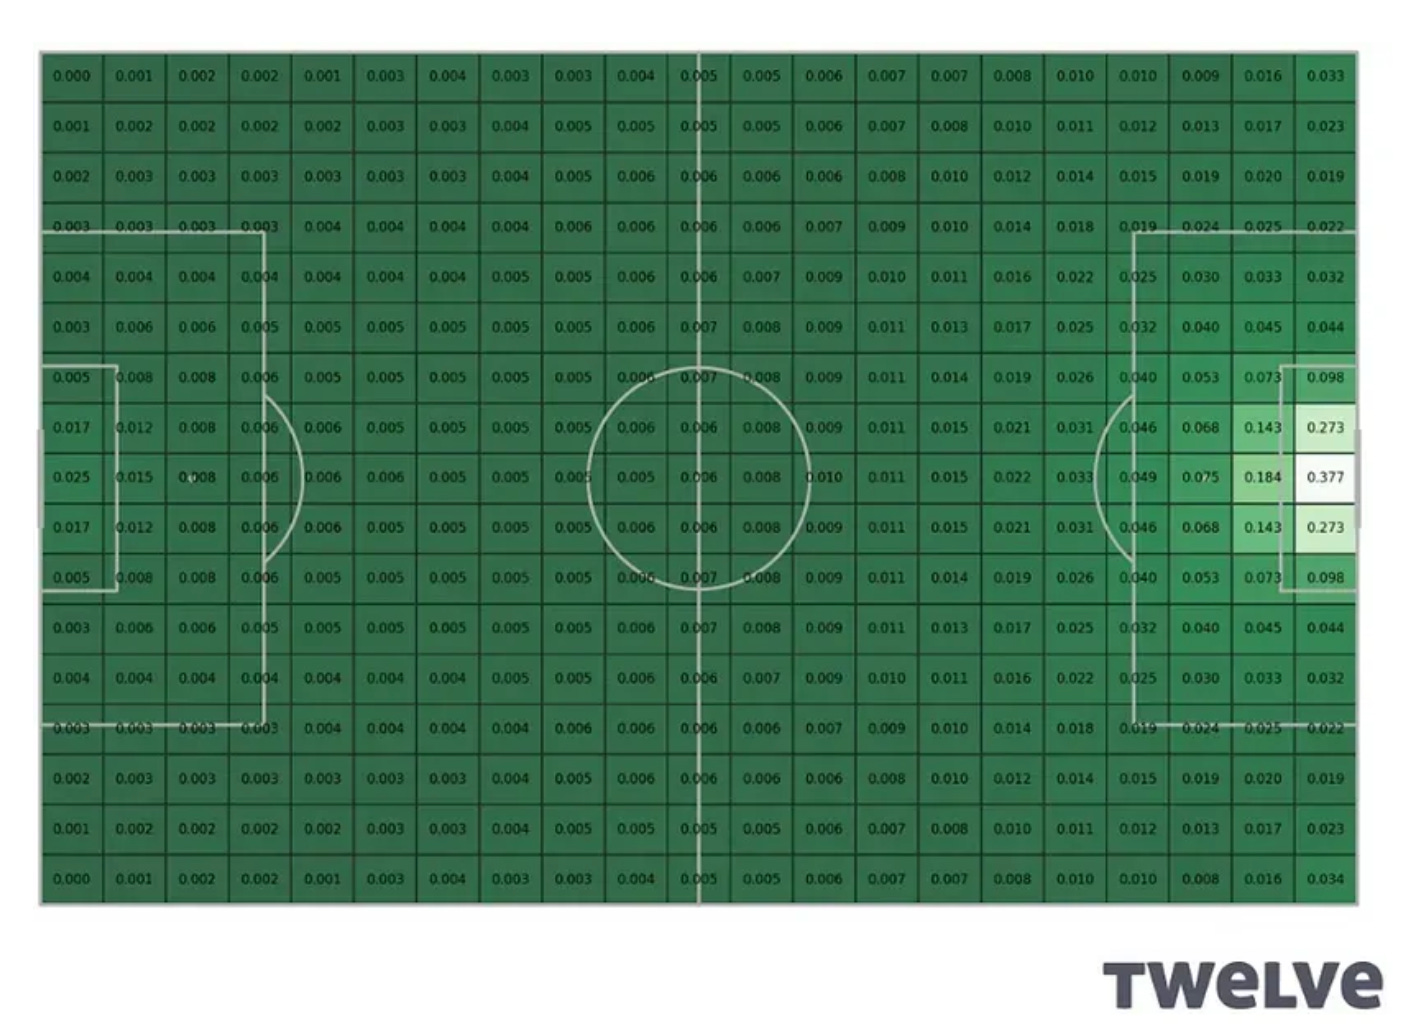
Nathan explains that there’s a difference between expected threat (xT) and expected goals (xG). The former is a metric calculated by dividing the pitch into small sections (see the image from Twelve Football above), then assigning each of those little sections a value based on the probability that a goal is scored from that section. In effect, xT measures how many threatening positions a player or a side take up with the ball, where ‘threatening position’ is based on historical probability of players scoring from that spot on the pitch.
So, using xT, Nathan’s explanation for why Spurs seem to be really threatening and create a lot of chances without registering as high an xG as we’d expect is that basically our final pass is lacking. By his reasoning—so far as I understand it—our xT is high because we’re taking up a lot of threatening positions, but then we’re rushing or botching that lethal final pass that might have led to a high xG chance on goal.
I agree with this explanation, but I think it’s important to add another dimension to it if we want to understand why the relative danger of Spurs’ attacks isn’t fully registered in xG.
As I noted above, expected threat is registered, i.e. measured, when a player with the ball takes up a space on the pitch. A player in that space could shoot, pass, do a backflip, or sit down on the ball and meditate—it doesn’t matter—and statisticians can still record xT.
By contrast, xG is a metric calculated by using historical shot data to model the probability of a player scoring a goal on a shot taken under a particular set of circumstances, e.g. distance to goal, angle, part of body used to take the shot, location and nature of the pass to the shooting player, and so on. In short, an xG of .4 means that players attempting a shot under those exact circumstances would typically score 4 out of 10 times. My language is getting a little delicate here (‘would typically score’ versus ‘did score in the historical data’) because xG is a probabilistic model based on historical data, not an actual accounting of historical data.
Nevertheless, you might have caught in the definition above the ONE BIG THING required to record xG: a player must attempt a shot!
In other words, you could work the ball into a really threatening position, like the center of the 6 yard box, with the keeper out of position. That would record xT. If the player in that situation takes a shot—whether they make it or not—that would record a pretty high xG. But if the player in that position opts instead to look for another pass—whether or not it leads to a goal—statisticians can’t record any xG for that particular scenario. No shot, no xG.
What I’m getting at is that, as Nathan A. Clark rightly explains, Spurs xG is underpowered because the final ball is often lacking. If we play that explanation out one more logical step, the rationale is that without a good final pass, teammates are not able to find a shot.
So what I want to emphasize is that when we’re seeing a gap between xT and xG, it might be because we’re just not taking enough shots from threatening positions. This appears to be the case according to the eye, as in last Monday’s match against Leicester City, and it looks to be the case statistically as well: not enough shooting from threatening positions.