


Big Chances
A telling way of looking at this enigma of a season.

You don’t need a deep dive into complex football statistics to see one of the strangest things happening in the Premier League this season.
Spurs sit 14th in the table with a goal difference of + 11. Immediately above Spurs are West Ham, with a goal difference of -14. That’s a 25-goal swing in Spurs’ favor, yet it’s West Ham above us in the table. You can’t look at that tell me it’s not completely bonkers.
Another way of looking at this: Spurs have the 5th best goal differential in the Premier League. Three teams with a negative goal differential—Aston Villa, Manchester United, and West Ham—sit above Spurs in the table.
In case you’re worried, no, this is not one of my ‘the underlying numbers prove we’re better than our table position!’ articles. I’m not even sure you could call something as straightforwardly important for predicting a team’s success as whether they score more goals than they concede an ‘underlying’ number. I’m just pointing this out because it’s simple, straightforward, and very, very odd.
Admittedly, you also don’t need a sophisticated statistical analysis to explain an important aspect of this oddness: Spurs have a better goal differential than table position because they tend to win by a lot in the games they win, and lose by just 1 goal in the games they lose. So, our goals are over-distributed toward our wins. Spurs have now played 32 games across all competitions this season, won 15, lost 12, and drawn 5. Of those 12 losses, 11 have been by just 1 goal.
But this is not an answer! OK, Spurs have scored lots of goals in the games they won, and kept it tight in the games they lost. But why? What’s going on? Are we just unlucky (Joel Wertheimer has done an excellent analysis of how unlucky we’ve been, by the numbers)? I don’t want to stop at ‘unlucky’; I want an answer. But maybe ‘unlucky’ points us in a promising direction.
Was I wrong?
One thing that’s stood out to me from watching Spurs this season is how wasteful Spurs have been in the final third. We can look at the concept of wastefulness in several different ways: Are we over- or underperforming our xG? Are we getting off shots in the first place when we get into dangerous positions? Are we turning territorial threat into goals? I’ve looked at these things, but I hadn’t taken a close look at another big, probably obvious measure of wastefulness:
Are we taking our chances?
For a while now, one of my hypotheses for explaining Spurs’ poor season has been that we create lots of big chances but don’t take them. Opta defines a ‘big chance’ as ‘A situation where a player should reasonably be expected to score, usually in a one-on-one scenario or from very close range when the ball has a clear path to goal and there is low to moderate pressure on the shooter. Penalties are always considered big chances.’ My eyes tell me, for example, that we’ve had quite a few moments of being through on goal and taken very little from them.
Am I right about that? My eyes tell me yes, but let’s see what the numbers say.
Big Chances: A Premier League Overview
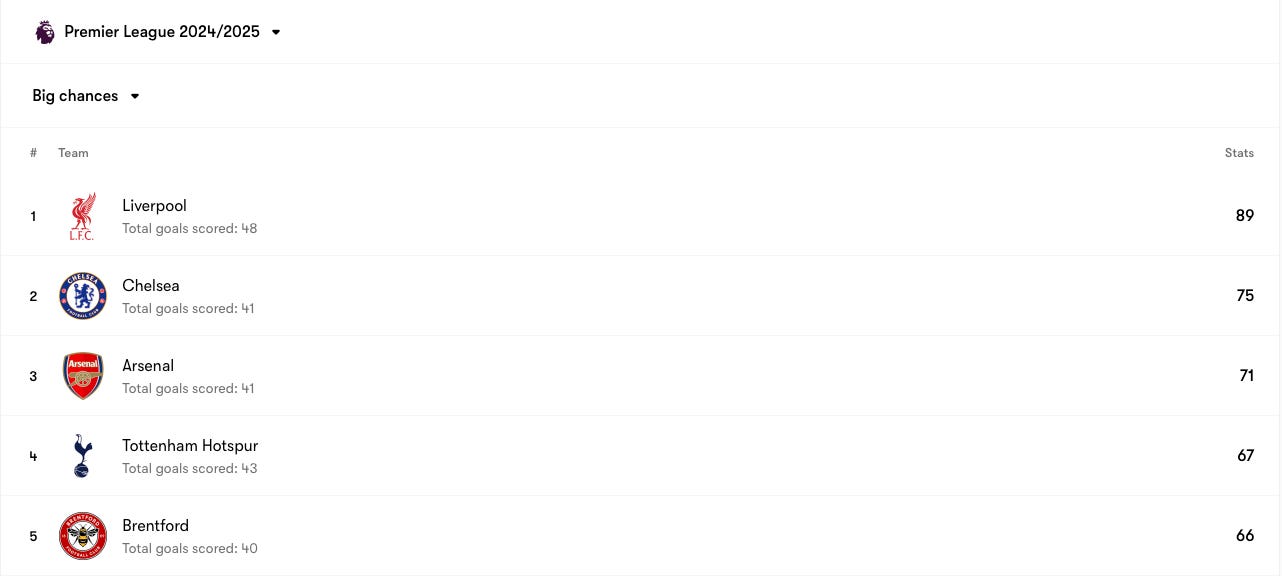
One part of this I was right about is that Spurs do indeed create a lot of big chances, the 4th most in the Premier League, injury crisis notwithstanding (charts courtesy of FotMob):
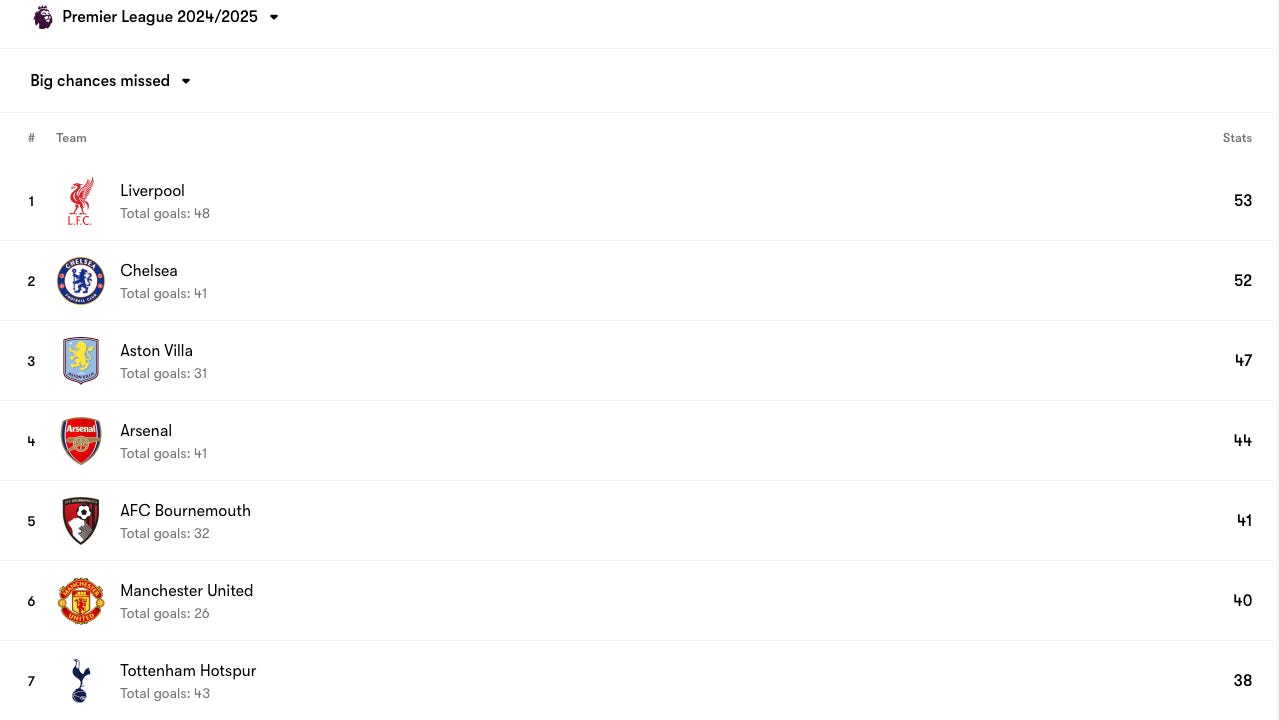
Spurs also miss a lot of big chances, the 7th most in the Premier League:
But again, this doesn’t tell us much without context. As you can see just from the two tables above, many of the same teams who create a lot of big chances also miss a lot of big chances. That’s probably because if you’re getting into positions to create big chances more frequently than others, you also create more opportunities to make bad decisions and blow your big chances more than others. Opta defines a ‘big chance missed’ this way: ‘A big chance opportunity when the player does not get a shot away, typically given for big chance attempts where the player completely misses the ball (air shot) but can also be given when the player has a big chance opportunity and decides not to shoot, resulting in no attempt occurring in that attack.’ Notably, missing big chances entails not getting shot off, another thing my eyes tell me Spurs have been doing lately.
So let’s discuss something interesting that I’ve been wrong about, eyes-wise. I put together a simple dataset of big chances created against big chances missed in the Premier League so far this season, which enabled me easily to see the aggregate percentage of big chances created versus missed across the league, as well as how teams rank in terms of percentage of big chances missed. This gives us an idea not just of who’s creating the most big chances, hence the most opportunities to miss them as well, but also who’s over- or under-performing the league average.
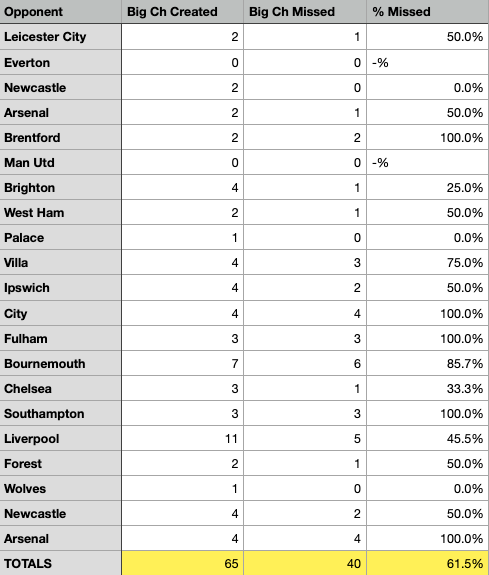
Here’s my table, sorted by percentage of big chances missed from highest to lowest:
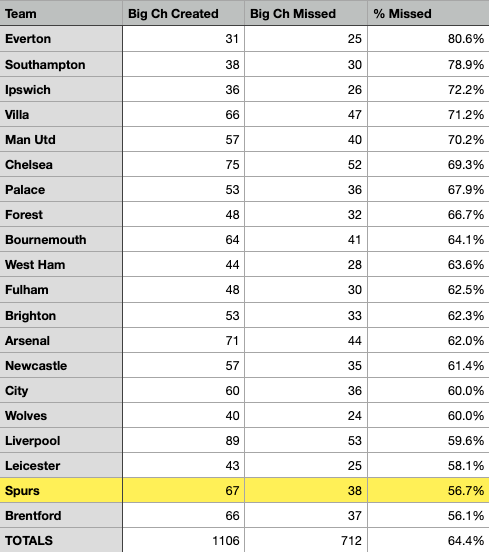
It might strike you that in terms of converting big chances, I was wrong: Spurs are actually the 2nd-most clinical side in the league when it comes to bagging big chances. Only Brentford have performed better. Further, Spurs’ rate of failing to convert just over half of their big chances created—56.7%—over-performs the league average rate of 64.4 % of big chances missed by about 8%.
So, two interesting conclusions so far: (1) Using Opta’s big chances created and big chances missed metrics, taking ‘big chances’ is harder than it might at first seem: more than 60% of big chances created across the league don’t result in goals; and (2) Spurs are more clinical in this regard than everyone in the league, bar Brentford.
Looking Closer: Big Chances in Spurs’ Matches
The above overview is interesting, but it doesn’t really explain anything about the gap between Spurs’ highly positive goal differential and low table position. Nor does it satisfy our queries above about what it means to be ‘unlucky’ in results, not just against the backdrop of prior seasons of Premier League performances with comparable goal differential and xG differential numbers to Spurs’ this season, but against what’s happening in our individual matches.
So I took a more granular look at big chances against Spurs (that is, what do our opponents’ figures look like when they play us?). And here again things get interesting, but not quite in the way I expected.
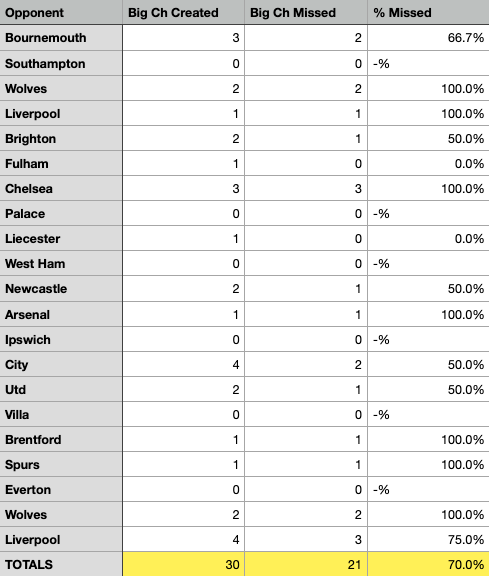
Here’s a table of our opponents’ big chances created, big chances missed, and percentages of big chances missed against us so far this season:
The first thing to notice is that opponents take big chances at roughly the same rate against Spurs as the league average, though they’re missing about 3% fewer big chances against Spurs than the league average.
However, if we put this in the context of what’s happening with other teams, the disparities start to become clear.
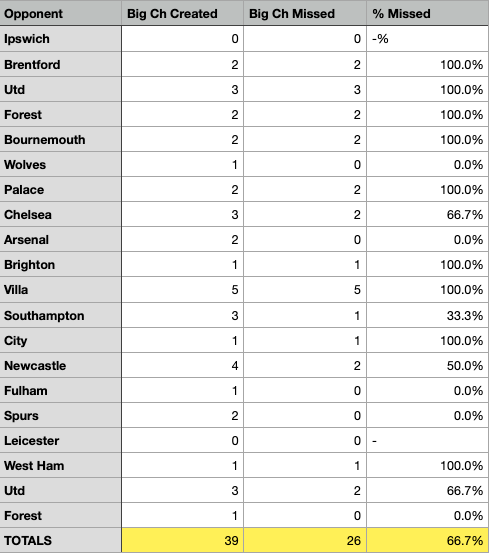
For example, Arsenal’s opponents have missed a whopping 69% of big chances against Arsenal this season:

Nottingham Forest are also having a hell of a season. They don’t create many big chances (48 in total, which is 14th in the league), but they don’t surrender many either. But of the big chances they do concede, their opponents have missed 70% of them!
Liverpool sit top of the table, so let’s have a look at their fortune for good measure:
Not quite as lucky as Arsenal and Forest have been in this regard, but about 3% luckier than the league average (as Spurs are about 3% unluckier than the league average, i.e. Liverpool’s opponents have missed about 6% more big chances against Liverpool than have Spurs’ opponents against Spurs).
Looking Even Closer at Spurs
From what we can see in terms of big chances versus big chances missed, Spurs’ opponents are close to the league average: they miss their big chances against us at an only slightly lower rate than average (both Chelsea (61.8%) and Villa (61.7%) are similar to Spurs (61.5%) in this regard). By comparison, teams such as Arsenal (69%) and Forest (70%) have been considerably more fortunate (between 5-6% more than the league average) with their opponents missing more big chances against them.
If we look even closer at Spurs, perhaps we can begin to form some more precise conjectures, if not conclusions. Here’s the Spurs table again (opponents’ big chances vs. big chances missed in their matches against us), only this time I’ve added a match results column on the right to make it easier to compare opponents’ percentage of big chances missed to the corresponding match results:
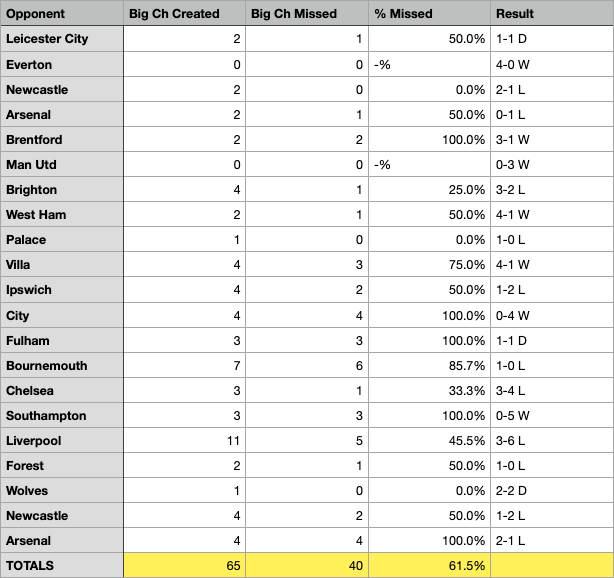
One simple thing that stands out is that when we’ve drawn matches this season in the Premier League (just 3 times), opponents have missed 50% of their big chances created against us. When we’ve lost games, opponents have missed 44.5%, well below the league average. And when we’ve won games, opponents have missed 75%, well above the league average. We’re dealing with small samples here on the whole, so nothing to make a big deal of just yet, at least not on that score. But I think it’s OK to say that when we’ve lost, our opponents have been unusually clinical against us. Again, when you’re losing the games you’re losing by just 1 goal on a consistent basis, the fine margins matter.
That’s especially the case if we look at some of our toughest losses, the ones where we had control of the game and still ended up losing. Brighton, for example, missed just 25% of their big chances against us (we took our only big chance against them in that match). Similarly, Chelsea missed just 33% of their big chances against us (while we missed 67% of our big chances against them, having created more big chances against them than they did against us).
That’s significant, I think. Brighton and Chelsea were 2 of the only 6 games this season in which our opponents missed fewer than half of their big chances. A third was the big 3-6 defeat against Liverpool, who missed just 45% of their incredible 11 big chances created, and I think anyone who watched that game would say that technical over-performance had a lot to do with the quality of the chances they had. In the remaining 3—the 2-1 loss to Newcastle at home, the 1-0 loss to Palace, and the 2-2 draw to Wolves—each of our opponents converted 100% of their big chances.
So now I think we’re starting to see something, at least in terms of the explanatory value of big chances. When we’ve lost or drawn, our opponents have been especially clinical by that measure, far more than the league average of about 64% of big chances missed.
In those same 3 games in which opponents took all of their big chances against us, we did basically the opposite, mirroring their over-performance with under-performance. Against Newcastle at home (L), we created 2 big chances and missed both. Against Palace (L), we created 2 big chances and missed both. Against Wolves (D) it was a little different, but still a slight under-performance: we created 5 big chances and missed 3.
A Telling Pattern Across the Season
Picking our heads up out of the weeds for a moment, it should be clear that one way to avoid the situations described above is simply to give away very few big chances. That’s a big reason why the likes of Arsenal and Forest, despite getting lucky with opponents’ finishing, are hanging out at the top of the table (especially Forest, who struggle to create much of their own).
Now, I’ve said in the past that, even though it’s boring and some pundits will frame it as an excuse, the best explanation for Spurs’ poor season to this point is the injuries. I’ve illustrated this in a number of ways with a number of metrics. So here’s one more:
I’ve marked the Villa match as the turning point or rough cutoff for Spurs in the league, the point at which injuries to our starting center backs, van de Ven and Romero, started to tank our ability to defend at the high level at which we were defending for the first quarter of the season (despite the evidence-free narratives of pundits). That was only made worse by losing Vicario shortly after.
So here’s a look at Spurs’ number of big chances conceded prior to Villa versus Villa and after, weighted on a per-game basis since the latter category includes more games. The difference is staggering:

To put this in perspective, the top 3 defenses in the league, by goals against and expected goals against, are Arsenal, Forest, and Liverpool (in different order by each metric). To date, Arsenal and Forest both give up just 1.4 big chances per game. Liverpool give up just 2 big chances per game. For good measure, since I made the dataset, Villa give up 2.2 big chances per game, and Chelsea give up 2.6. In the aggregate this season, Spurs have given up 3.1 big chances per game. But as you can see in the basic chart above, when Spurs had both starting center backs playing, we were giving up just 1.7 big chances per game.
Let me say that again for all of the ‘naive high line,’ ‘Spurs are way too open,’ ‘Spurs are easy to play against’ narrative enthusaists: With both starting center backs in the team, Spurs were giving up just 1.7 big chances per game, which would put them right in the thick of the best defenses in the Premier League by that metric, better, in fact, than table-topping Liverpool, who’ve conceded exactly 1 goal per game this season from 2 big chances per game allowed.
After the injuries, however, and with more injuries compounding the loss of our two starting center backs, our big chances conceded per game skyrocketed to 4.2. I haven’t made a full dataset for the league, but my guess is that’s among the worst.
It’s the injuries.
To conclude, having taken a deep dive into big chances, I think we have yet another metric to demonstrate that the story of Spurs’ season so far is a story of the injury crisis, in particular the loss of both of our starting center backs for more than a month now, then the loss of our starting goalkeeper. We shouldn’t be surprised that Spurs’ defending has taken a nosedive across virtually every metric, and that amid that nosedive we’ve also run into some hard luck with respect to lesser opponents finishing their chances at an unusually high rate (against the league average). I don’t think big chances tell the whole story, but they do tell an important part of it that hasn’t yet been told amid the narratives that Ange’s tactics are to blame, or the platitudes about ‘steel’ or ‘mettle’ or ‘grinding out the close ones’ by putting in ‘the hard yards.’ All yards are hard when you’re playing in the most intense league in the world with a patchwork defense.
It will be become tedious if I comment “the prof does it again!” on every post so please assume the comment until I comment otherwise.
Excellent! This is the kind of definitive analysis any sports field would benefit from no fence sitting. Conclusion backed by data!
( It be time to expand from just Spurs and entertain other sports Doc. Probably more lucrative).